How to see voltage in the brain?
Our brains employ a zoo of chemical messengers for intra- and inter-cellular communication: Neurotransmitters like glutamate, acetylcholine and GABA, neuropeptides like NPY, CART and SST, and charged ions like calcium. These substances are released at specific sites and diffuse to their targets. However, diffusion is a slow process. The intracellular diffusion coefficient of , a small ion that diffuses much faster than larger molecules, in neuronal dendrites is on the order of only 20μm².
To enable our brains to compute and our nerves to conduct on a much faster timescale, signal transmission through membrane potentials has evolved as a much more rapid-fire alternative. These voltage signals are conducted as a imbalance of charges across a lipid membrane, much like two capacitor plates with a dielectric layer in between.
Decoding and understanding these electrical signals in our brains is our primary way to interface with our brains in a targeted way. Implantable brain-machine-interfaces provide an important technology for this reason. They measure extracellular voltages, i.e. minuscule potential differences on the order of μV induced in the resistive fluid surrounding neurons when ion channels open and pass currents. This potential difference can be picked up by nearby needle electrodes. These same electrodes can also be used to locally stimulate nearby neurons with a current, thereby forming an interface. Other approaches to such interfaces use indirect measures, like neurovascular feedback. These approaches include functional MRI, functional NIR, and functional ultrasound (the latter of which my friend Raffi is working on!).
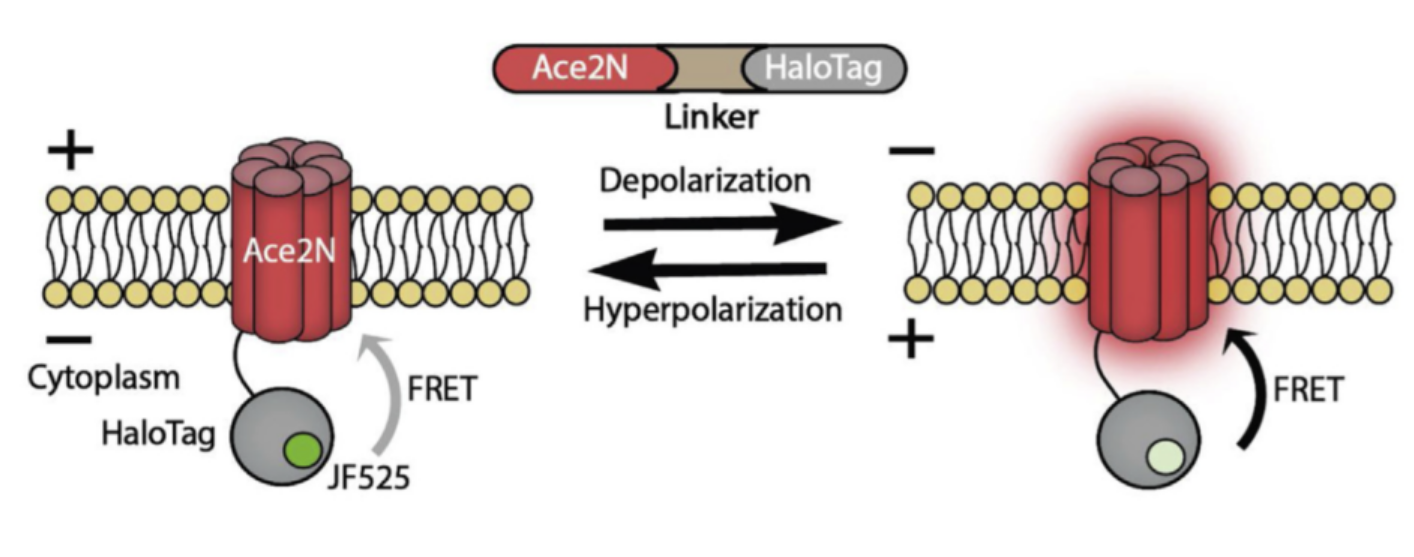
An alternative, less well known method to interact with the brain is through an all-optical interface. Electrochromic dyes or proteins change their brightness in the presence of an electric field, and provide an unmediated readout of the local membrane voltage that can be observed through a microscope. This approach circumvents the necessity of implanting electrodes (although this still requires a cranial window for optical access to the brain). I work with a special breed of such voltage sensors, a group of proteins is genetically encoded voltage indicators (GEVIs). These proteins can be targeted to specific cells or cell types in any part of the brain. A GEVI in combination with optogenetics (using a Channelrhodopsin to stimulate neurons also using light) form the loop for the optical interface: readout and stimulation is fully handled using light of different colors, without the need for any implants inside the brain!
 Adapted from this paper.
In this blog entry, I want to go over two projects I have been working on throughout grad school, both imaging voltage in neurons, but across different scales. The first of these looks at voltage at a small scale, namely how action potentials back-propagate into the dendritic tree of a hippocampal mouse neuron. The second project asks how the voltage dynamics of whole populations of neurons are guided by the genetic programs executed by these populations.
Single cell scale: Action-potential backpropagation in CA1 neurons
Paper Link: Dendritic excitations govern back-propagation via a spike-rate accelerometer
Updating synaptic weights in response to inputs from other neurons is the primary mode that neurons employ when learning new information. In this process called neuroplasticity, the Hebbian adage goes "Neurons that fire together, wire together". However, simply spiking together is not the full story. This experiment, made possible only using voltage imaging, shows that different parts of a neuron require different spiking patterns to initiate weight updates, and in particular shows a kind of error-correcting mechanism that differentiates between accidental spike coincidence and meaningful spikes for apical dendrites in hippocampal CA1 cells.
The hippocampus is a major player in memory formation. Named after seahorses, it resembles a curled up arrow. The neurons of interest are found in the region cornu ammonis 1, marked CA1 here.
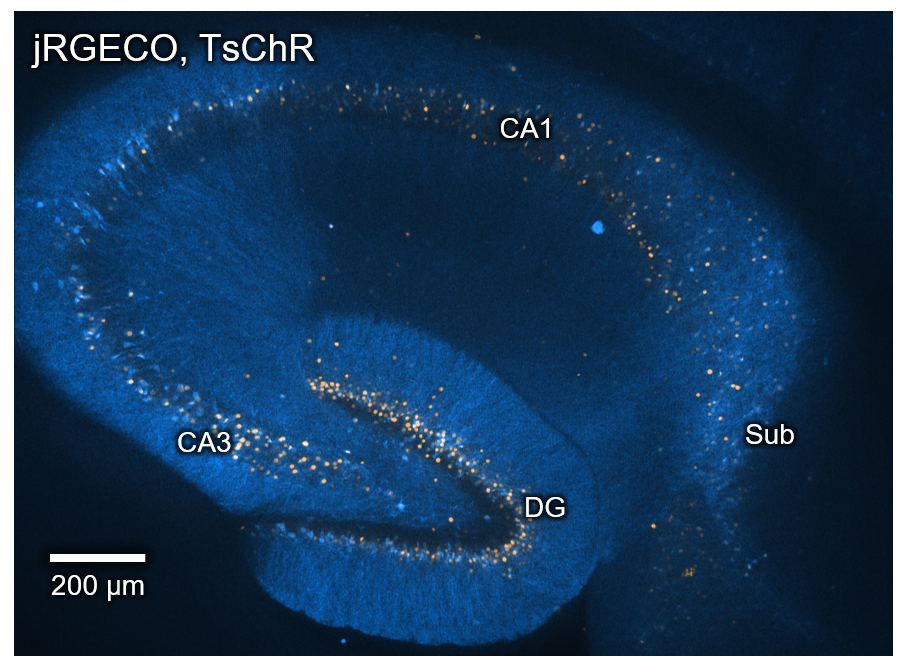 Image by Vicente Parot.
These neurons have a long extension in one direction, perpendicular to the arrow's direction, with dendrites far away from the cell body along this arbor called apical, while those closer to the soma are called basal or proximal.
In this experiment, we expressed the GEVI Voltron and Channelrhodopsin CheRiff in some of these neurons in CA1 cells in a mouse brain. After slicing the brain into this slices that are kept alive in a artificial cerebrospinal fluid solution, we were able to image these cells using a fluorescence microscope. A DMD can be used to illuminate specific parts of neurons in order to create a locally stimulus using blue light, while the voltage signal is read out in a red color channel.
Action potential (AP) backpropagation and neuroplasticity
Here, a stimulus is placed on a proximal dendrite:
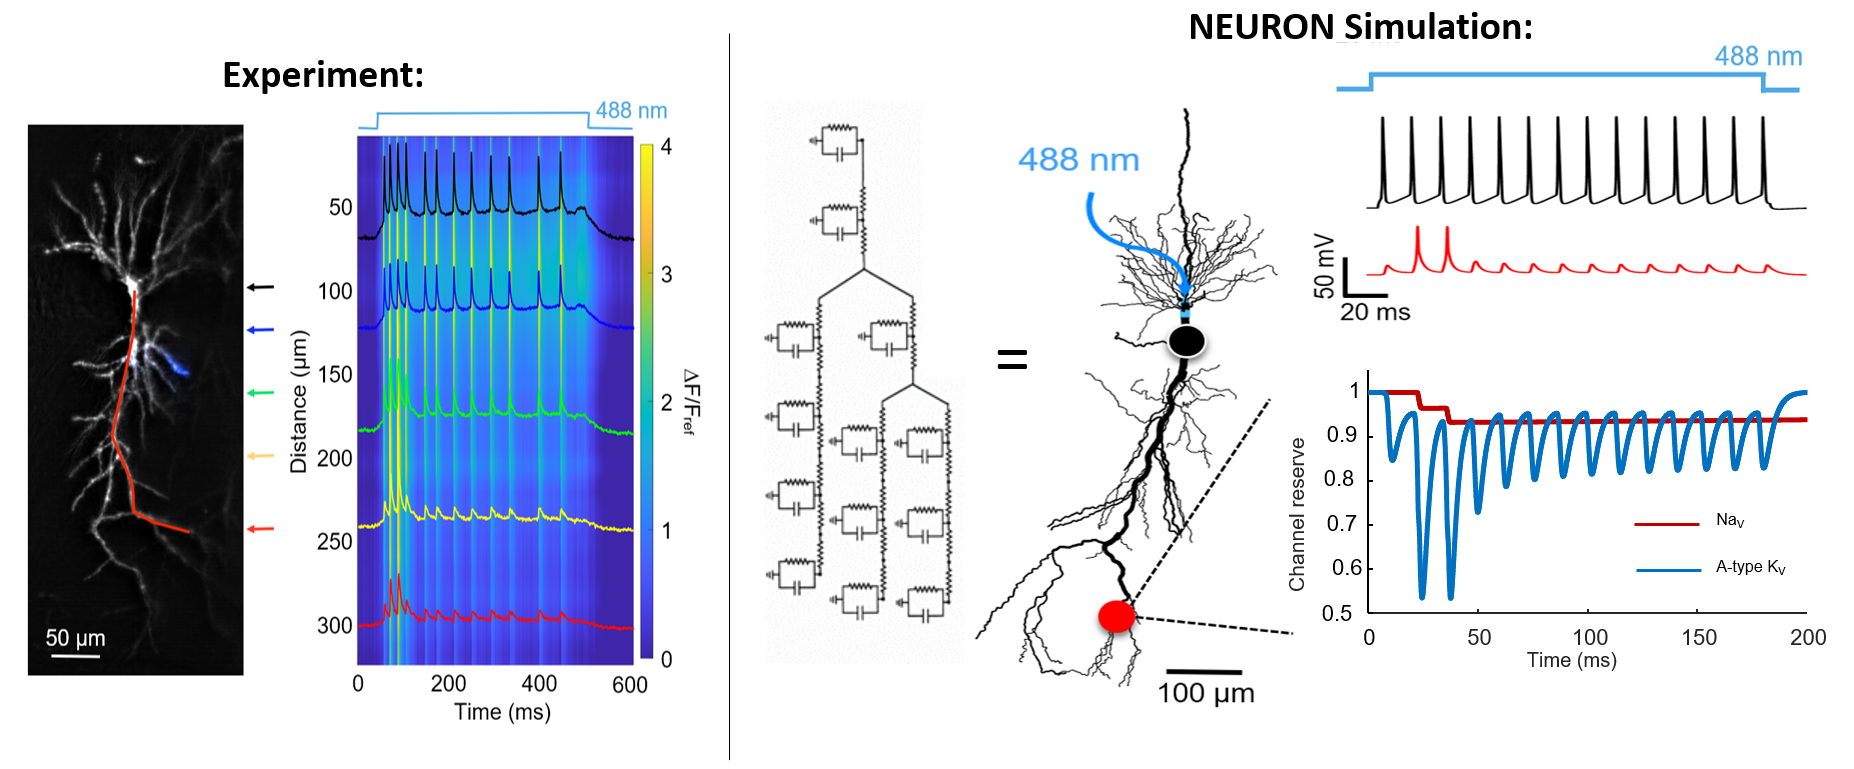
The left panel shows the experiment: A beautiful dendritic arbor with the voltage signal plotted along the arbor as a function of distance form the soma as a change if fluorescence. Following the stimulus onset, the neuron starts spiking. These spikes originate at the cell body, and back-propagate through the arbor into the apical dendrites. What is striking here, is that in the more distal regions, the spike amplitude is reduced, but not for all spikes equally.
The first spike is filtered out, then 2-3 spikes make their way into the dendritic arbor unimpeded, after which they are filtered again. This is a very interesting and unexpected result!
Neuroplasticty requires a coincidence of two things to engage NMDA channels:
- Glutamate input to a synapse from upstream neurons.
- The local voltage needs to be elevated relative to resting (depolarization).
For an input like this, we see that only the unfiltered spikes are able to induce changes in synaptic weights. There are two interesting implications of this. A single spike produced by a perisomatic stimulus cannot induce plasticity in apical dendrites. Only a burst of quick spikes can. This can be thought of as an error correcting scheme. A single spike can transmit information, but can also happen as a consequence of random noise. If only quick bursts are inducing plasiticity, this means that synaptic weights are insensitive to such noise.
Furthermore, a sustained continuous high firing rate cannot induce plasticity either. The synapse weights are not sensitive to the baseline spike rate, only when the spikerate shifts relative to the baseline firing rate do synaptic changes occur.
These findings are consistent with a popular model of neuroplasticity, the Bienenstock-Cooper-Munro model. It solves one of the major shortcomings of classical Hebbian plasticity, namely that synaptic weights don't increase indefinitely. Instead, there is a kind of setpoint where the stronger a synapse already is, the harder it gets to make it even stronger. These experimental findings provide an explanation for this: With a stronger synaptic weight a neuron's baseline firing rate may increase, but this does not affect synaptic weights. Only an accelerated spike rate does.
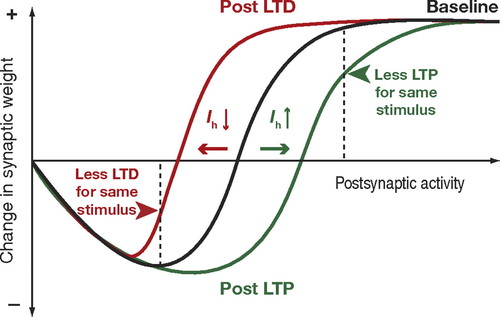 Synaptic plasticity vs. firing rate in BCM model, due to this paper.
Biophysical simulation of AP backpropagation
Simulations can help us make head or tails of how this filtering is occuring. A simulation in NEURON and its results are shown next to the experimental results, recapitulating them well. The major players necessary for this effect are A-type potassium channels and voltage-gated sodium channels with a slow inactivation gate.
Using the morphology of a real CA1 neuron, we break it up into hundreds of segments and distribute different channel conductances known to be found in CA1 dendrites:
- Passive leak: Constant.
- Voltage-gated sodium channel in soma: Temporary fast inactivation during an AP only.
- Voltage-gated sodium channel in dendrites: Temporary fast inactivation during an AP, persistent slow inactivation over time.
- Voltage-gated potassium channel: Fast inactivation after an AP only.
- Voltage-gated A-type potassium channel in dendrites: Open at resting potential, closes slowly but faster than slow sodium channel inactivation during spikes.
- Light-gated channelrhodopsin: Targeted stimulus around soma.
This model shows the same behavior as the neurons in the experiment, but we can look under the hood:
During the first spike, neither the slow-inactivation Na channels or the A-type K channels are inactivated yet. The A-type K channel provide a leak conductance and prevent AP backpropagation into the arbor. The voltage does not rise high enough to cause slow-inactivation of the Na channels, but the A-type potassium channels start to be inactivated.
In the following couple spikes, the reduced A-type conductance cannot prevent action potential backpropagation, and the Na channels are still active, hence the AP backpropagates and synaptic plasticity can take place.
After multiple successfully backpropagated spikes, the slow inactivation of the Na channels takes over. A new balance of inhibitory K-conductance and excitatory Na-conductance is established and later spikes are filtered out again.
This plot illustrates this filtering process clearly (note that the left and right plots are for different apical dendrites):
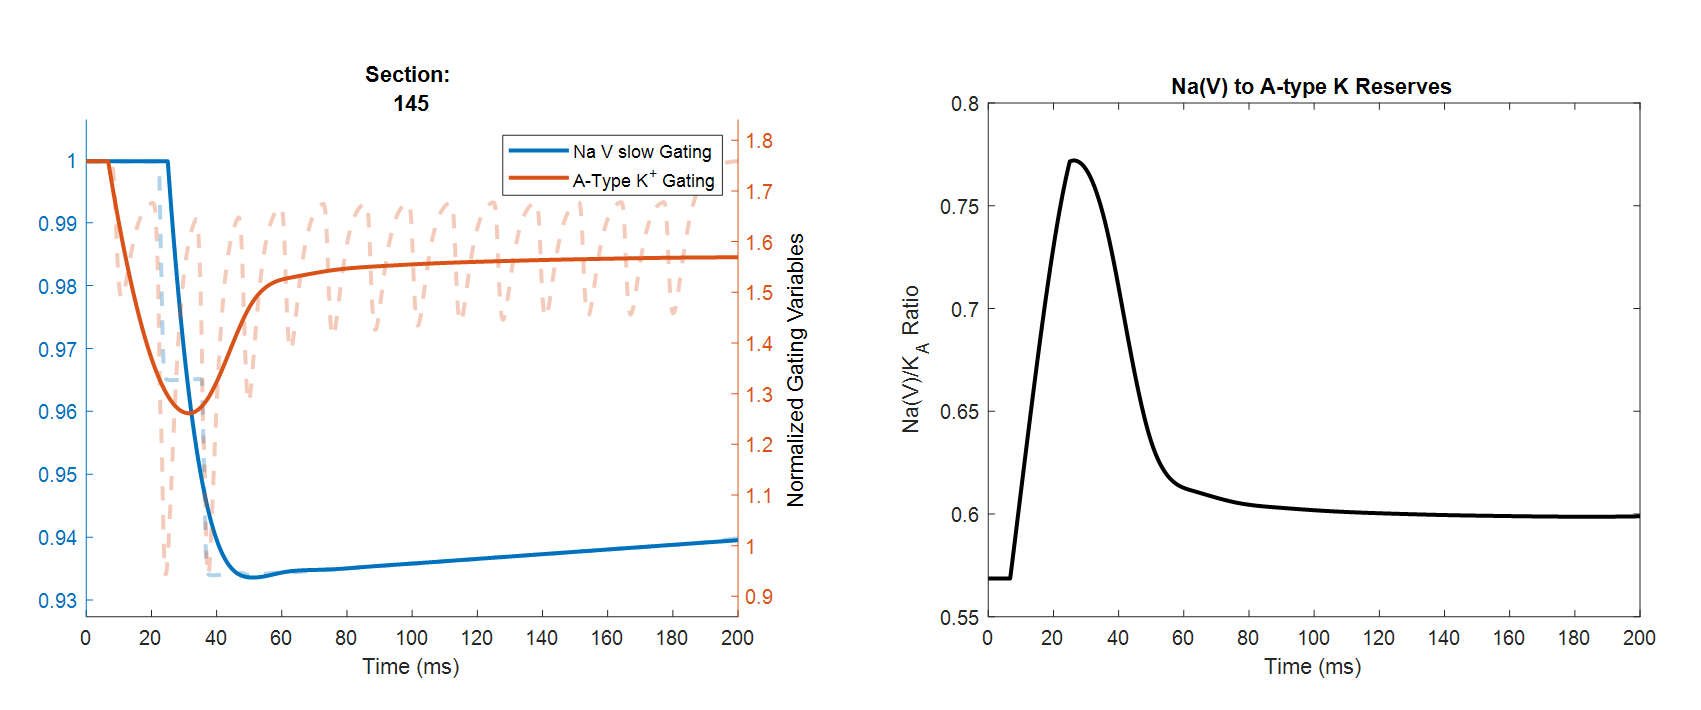
The window of backpropagated spike transmission lines up with the period where the ratio of Na-channel reserves to A-type channel reserves is large (~15-50ms in the plot). This window is set by the difference in inactivation rates of the two channels.
Widefield voltage imaging and transcriptomics: How do genes control electrical activity in neurons?
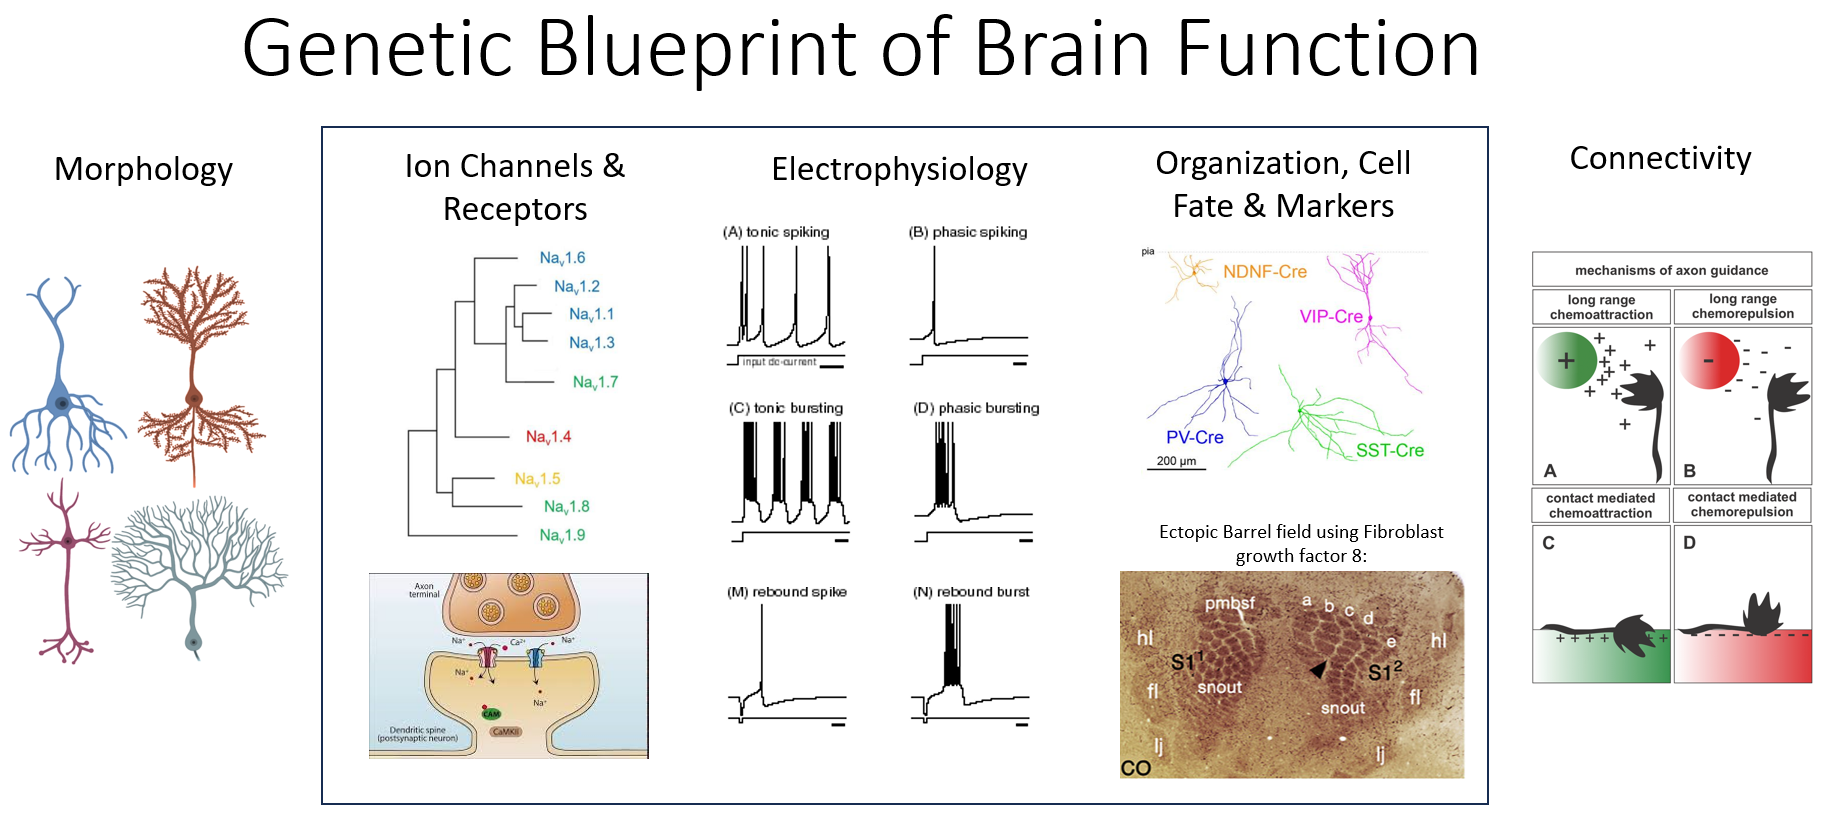
Different types of neurons are fulfill different roles and show diverse firing patterns in response to the same stimulus. The difference between these neuron types lies in the pattern of gene expression. Once a neuron progenitor is on the path to differentiating into a specific cell type, gene regulatory network act to turn specific channels, receptors and markers on and off. The patterns of gene expression direct all aspects in the life of a neuron:
This experiment probes the connections between the three phenotypes outlined above.
Different cell types show variation in the expression of different ion channels and firing patterns. Electrophysiological spiking waveforms measured using patch clamp or voltage imaging are sums over the contributions of all ion channel currents present, but how exactly different specific genes affect neuron electrophysiology is not known.
An example where this is known is cardiology. The Ten-Tusscher model provides a canonical description of the relevant currently and ion channels. The currents responsible for different parts of the cardiac action potential can be simulated, so that pathological deviations can be traced back to specific genes and channels. This allows targeted treatment of these pathologies and enables drug discovery directed towards these receptors or channels.
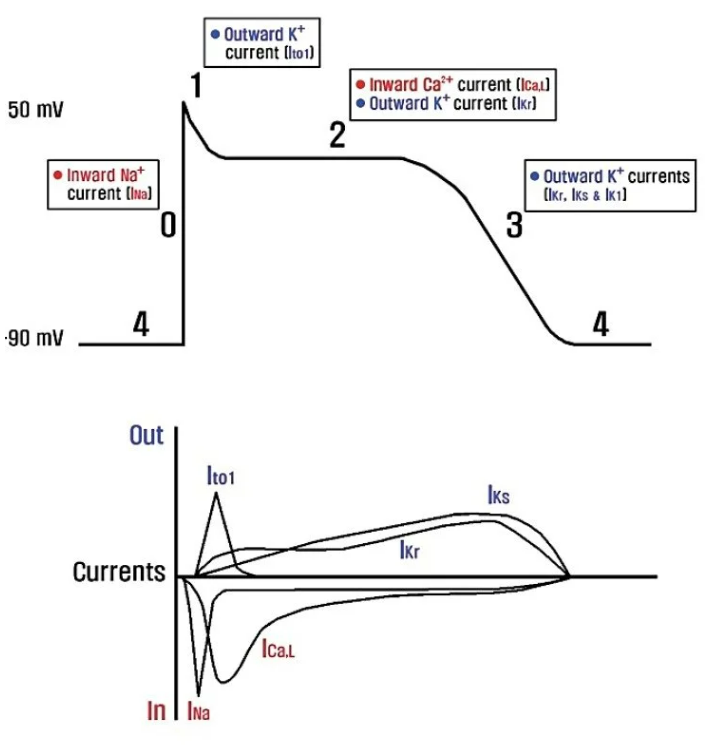 Adapted from this paper.
Such a model for neurons is lacking, making drug discovery difficult and requiring significant research to track down the specific mutations or deficiencies responsible for pathological spiking patterns. In lieu of taylored, minimally invasive treatments, interventions are often more like blunt cudgels.
Widefield voltage imaging in cultured neurons
Widefield voltage imaging provides a valuable insight into the variability of firing patterns at a single cell resolution. With the same Voltron-CheRiff as described earlier, high-throughput voltage imaging can show these differences relative to some stimulus waveform.
Here, primary rat neuron in-vitro are imaged at 2.3x magnification on a widefield fluorescence microscope. This glamor shot shows the cells spiking when the blue light stimulus is activated:
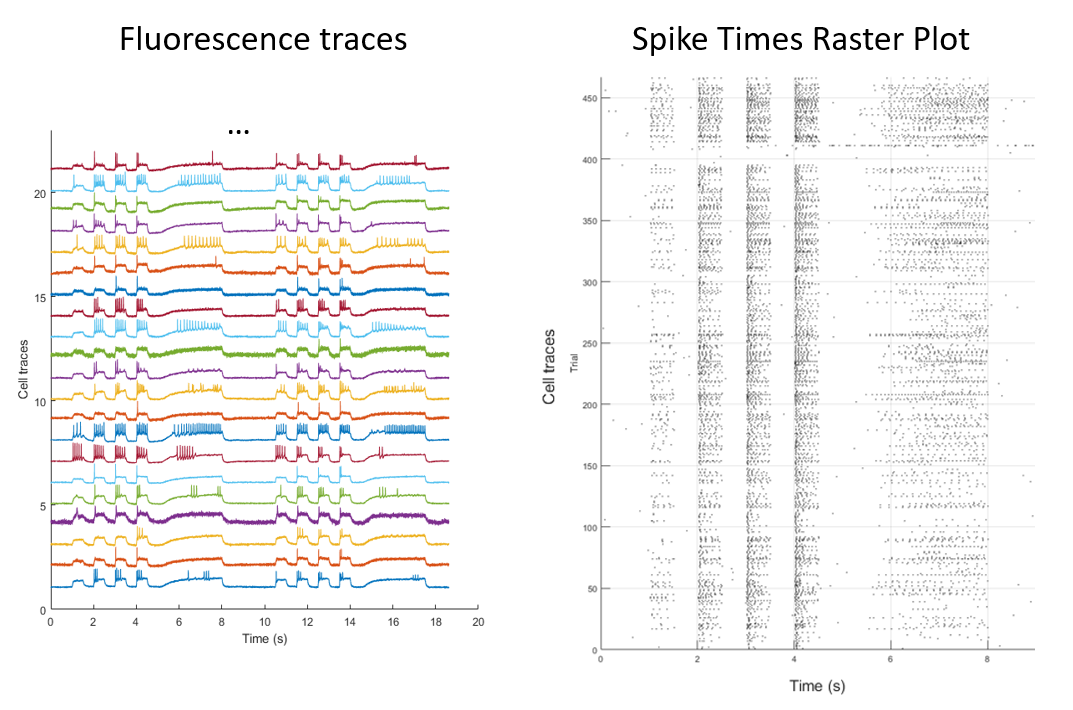
After extracting the spiking waveforms from the data, we're left with a fluorescence waveform for each neuron.
These waveforms can be further analyzed to identify spikes and find the firing rates and average spike shapes for each neuron.
As a result, we're left with a vector of neuron-specific parameters, that encapsulate the neurons spiking behavior. Using this platform, we can then apply a drug or other perturbation, and record the electrophysiological changes for each neuron.
The throughput of this method is massive compared to patch-clamp based methods like patch-seq. A single field of view can contain upwards of 1000 spiking cells, resulting in >100,000 spiking traces per hour.
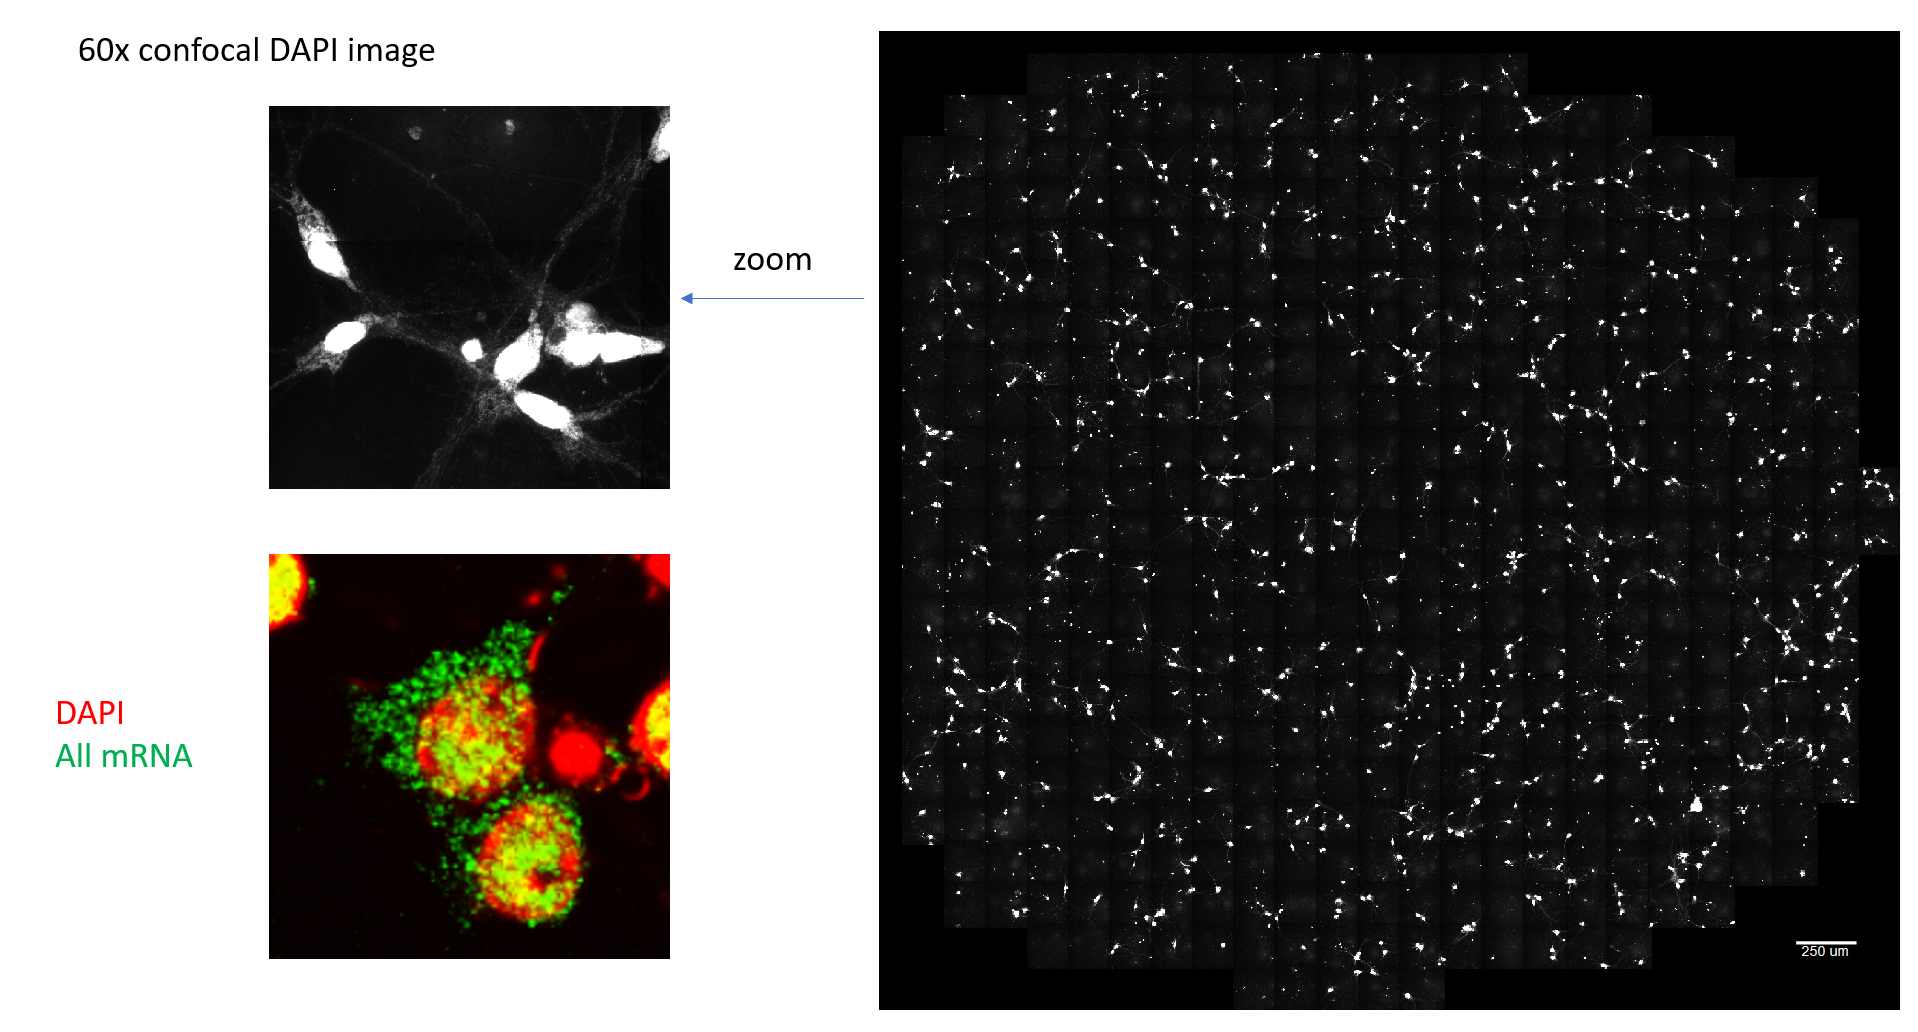
MERFISH: linking gene programs to electrical phenotypes
This technique can be combined with spatial transcriptomic methods like MERFISH to find the gene expression patterns of hundreds of genes of interest
for each cell. These techniques rely on fluorescently labelling mRNA constructs and imaging at high magnification to resolve individual
mRNA's as separate puncta (each green spot in the image below is a single mRNA molecule).
MERFISH relies on combinatorial, error-robust barcoding to identify many RNA species in the same sample without needing a unique fluorophore per gene. Instead of assigning one color = one gene, each target transcript is assigned a binary barcode (a short Hamming-distance-separated codeword). The sample is imaged over many rounds; in each round, a subset of genes is turned "on" via fluorescent readout probes, producing a punctum wherever that transcript sits. We stack those on/off observations across rounds, decode the barcode for each punctum, and we recover the gene identity and can segment the image to assign it to the cells in our voltage imaging data.
In this project, MERFISH represents the missing molecular readout for the widefield voltage imaging platform: voltage gives a per-cell electrophysiology signature, and MERFISH gives a per-cell expression vector.
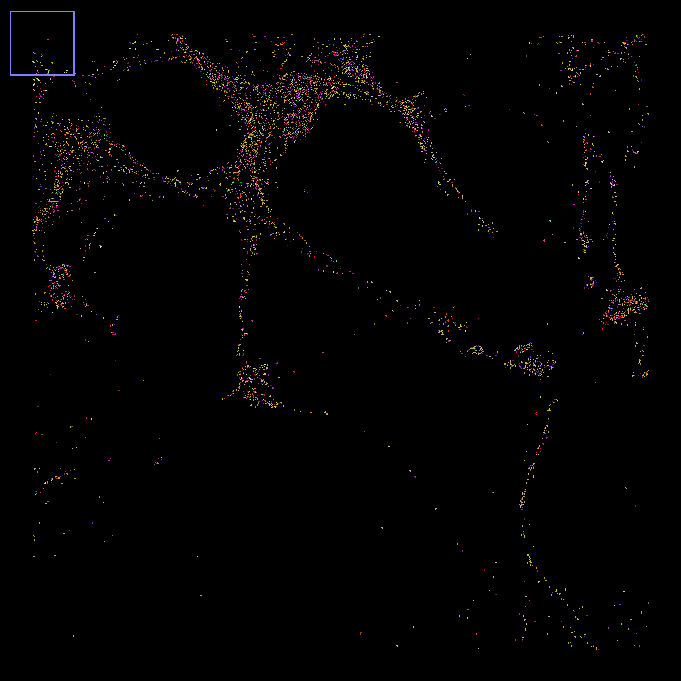
This false-color image shows the assigned mRNA identities for a single z-slice zoomed into a handful of cells, with a each mRNA assigned its own RGB color:
Two details make MERFISH especially useful for measuring gene expression here:
-
Error correction: MERFISH uses a codebooks with redundancy so that a up to two bit-flips still map back to the intended gene if an imaging rounds fail for any reason.
-
Spatial resolution: MERFISH maintains the spatial structure of the cell culture during imaging, so that individual cells can be found in both datasets.
A targeted MERFISH library for electrophysiology
Typically, MERFISH is employed as a tool to identify cell type identity, so that published libraries lack many of the genes of interest for functional electrophysiology. For this experiment, a new library containing 817 genes needed to be designed from scratch, which includes:
- Ion channels (Na, K, Ca, HCN, leak): primary determinants of spike waveform and excitability.
- GPCRs: slow neuromodulatory control over gain, adaptation, and state-dependent firing.
- Ligand-gated receptors: synaptic drive and inhibitory/excitatory balance.
- Markers: rough assignment to cell-types.
- Housekeeping genes: normalization and basic QC.
- Cell health / stress markers: keep track of general cell health variation between samples.
One important thing to note is that while we're trying to infer electrophysiological contributions of ion channels, mRNA levels do not tell the full story. Between translation, alternative splicing, trafficking, different combinations of subunits, phosphorylation and variable protein half-lifes, the real contribution of a gene to conductance varies gene to gene and cell type to cell type.
This is a project in progress. Check in later for future updates!